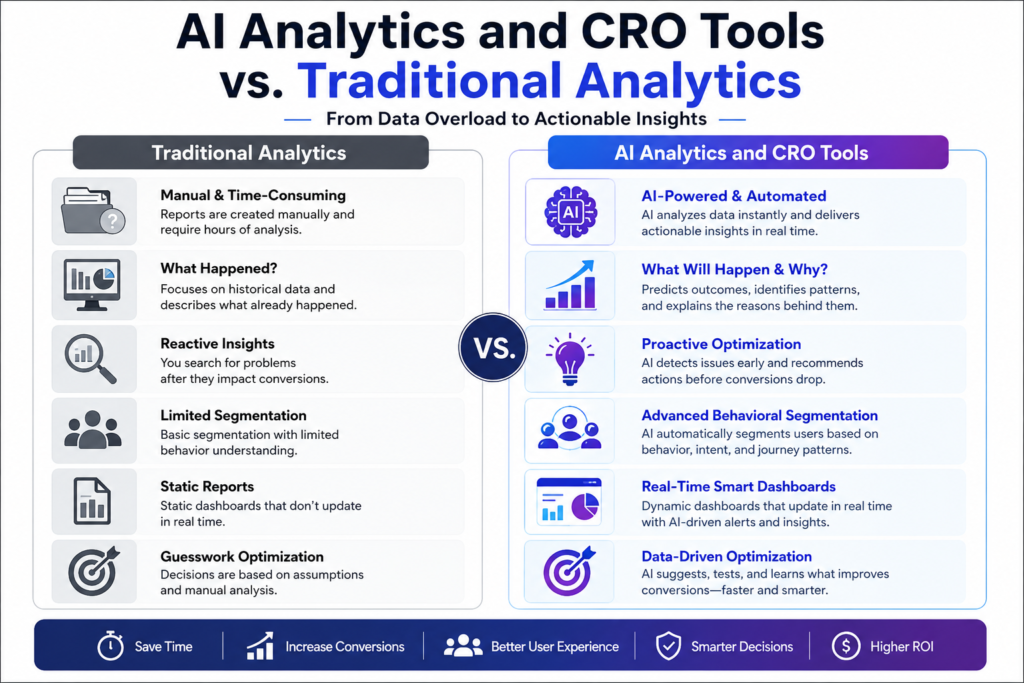
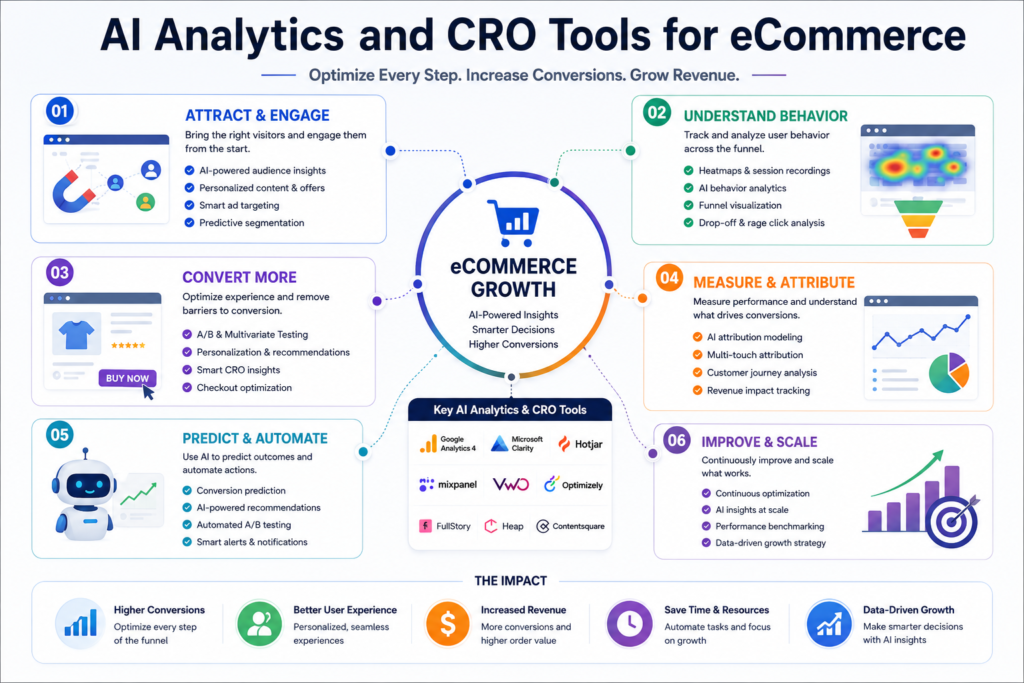
Traditional analytics usually requires the user to decide what report to open, which segment to examine, and what pattern to investigate.
AI-assisted analytics can help by:
Detecting unexpected increases or decreases Summarizing complex reports Predicting purchase or churn probability Grouping similar customer behaviors Identifying likely conversion barriers Suggesting questions or test ideas Allowing users to query data in natural language
Google Analytics, for example, uses machine learning to generate predictive metrics such as purchase probability, churn probability, and predicted revenue when a property meets the applicable data requirements. (Google Help)
AI Analytics and CRO tools Solve Different Problems
Discipline
Primary Question
Typical Output
Web analytics
What happened?
Traffic, events, revenue and funnel reports
Behavioral analytics
How did visitors interact?
Heatmaps, recordings and journey patterns
Customer research
Why did it happen?
Survey responses, interviews and objections
Predictive analytics
What may happen next?
Propensity scores, forecasts and risk alerts
Experimentation
Did the proposed change work?
Measured uplift, loss or inconclusive result
Personalization
Which experience fits this visitor?
Segment-specific content or offers
A strong optimization program uses all six layers rather than relying on one dashboard.
How AI Is Changing AI Analytics and CRO tools
Quick Answer: In 2026, AI is reducing the time required to move from raw behavioral data to a testable hypothesis. Modern platforms can summarize sessions, detect anomalies, answer natural-language questions, predict outcomes, and generate experiment ideas. Human judgment is still required to validate context, business relevance, data quality, and statistical evidence.
Faster Insight Discovery
A marketer may have thousands of customer journeys, event combinations, and session recordings to examine. AI Analytics and CRO tools can reduce this workload by grouping related behavior and summarizing recurring patterns. Microsoft Clarity, for example, offers AI-assisted session insights, while its grouped insights capability can summarize multiple recordings filtered by attributes such as device, events, campaign, or visited page. (Microsoft Learn)
This does not mean the AI has established the cause of a conversion problem. It means the system has helped identify where a human should investigate.
Natural-Language Data Exploration
Instead of building every report manually, teams can increasingly ask questions such as:
Which acquisition channel produced the most repeat purchasers?
Where do mobile visitors leave the checkout?
Which product features correlate with higher retention?
Did the new pricing page change demo requests?
What behavior is common among high-value customers?
Natural-language interfaces make analytics more accessible, but the quality of the answer still depends on accurate event tracking, naming conventions, attribution logic, and data governance.
Predictive Segmentation
Predictive systems can identify visitors who are more likely to purchase, churn, upgrade, or return.
These predictions may support:
Retargeting audiences
Email prioritization
Personalized product recommendations
Customer-success interventions
Promotional suppression
High-intent audience analysis
A predictive score should be treated as a probability, not a guarantee.
Automated Hypothesis Generation
AI can transform observations into structured test ideas. For example:
Observation: Mobile visitors frequently return to the shipping-information section. Possible AI-generated hypothesis: Visitors may not understand delivery costs or arrival dates before checkout. Potential test: Display estimated delivery dates and shipping thresholds directly on product pages. Primary metric: Product-to-checkout rate. Guardrail metric: Refund or cancellation rate.
The system accelerates ideation, but the optimization team must decide whether the hypothesis is logical, technically feasible, ethical, and valuable enough to test.
Essential AI Analytics and CRO Tools Capabilities
Quick Answer: The best platform is not always the one with the most AI features. Pick tools that offer reliable data, useful segmentation, clear behavioral context, good experiment tracking, helpful integrations, strong privacy controls, and transparent results. AI should help you analyze faster, but not hide how it reached its conclusions or push changes that have not been checked.
Core Capability Checklist
Capability
What It Should Help You Do
Warning Sign
Event analytics
Measure important customer actions
Tracking only pageviews
Funnel analysis
Locate major journey drop-offs
Inconsistent funnel definitions
Segmentation
Compare meaningful audience groups
Too many unused segments
Heatmaps
See aggregate clicks and scrolling
Treating visual activity as intent
Session replay
Investigate individual experiences
Recording sensitive information
Surveys and feedback
Understand motivations and objections
Asking biased questions
Anomaly detection
Find unusual changes quickly
Alerting without business context
Predictive analysis
Estimate future behavior
Presenting probability as certainty
A/B testing
Measure causal impact
Stopping tests when results look positive
Personalization
Tailor experiences by segment
Creating experiences without validation
AI summaries
Reduce manual review time
Summaries without links to evidence
Integrations
Connect marketing, product and revenue data
Isolated dashboards
Governance
Maintain consistent definitions and access
Uncontrolled event creation
Transparent AI Outputs
A useful AI-generated insight should show:
The observation: What pattern was detected?
The segment: Which visitors were affected?
The timeframe: When did the behavior occur?
The evidence: Which sessions, events, or reports support it?
The confidence: How strong or consistent is the pattern?
The next action: What should a person investigate or test?
Avoid tools that make strong recommendations but do not show the evidence behind them. Privacy and Data Controls
Privacy and Data Controls
Your platform should support appropriate controls for:
Personally identifiable information
Form-field masking
Consent management
Data retention
User access
Data deletion
Geographic storage requirements
Internal governance
Always set up analytics and replay tools to follow the law, your company’s policies, and the latest instructions from the platform.
Best AI Analytics and CRO Tools by Use Case
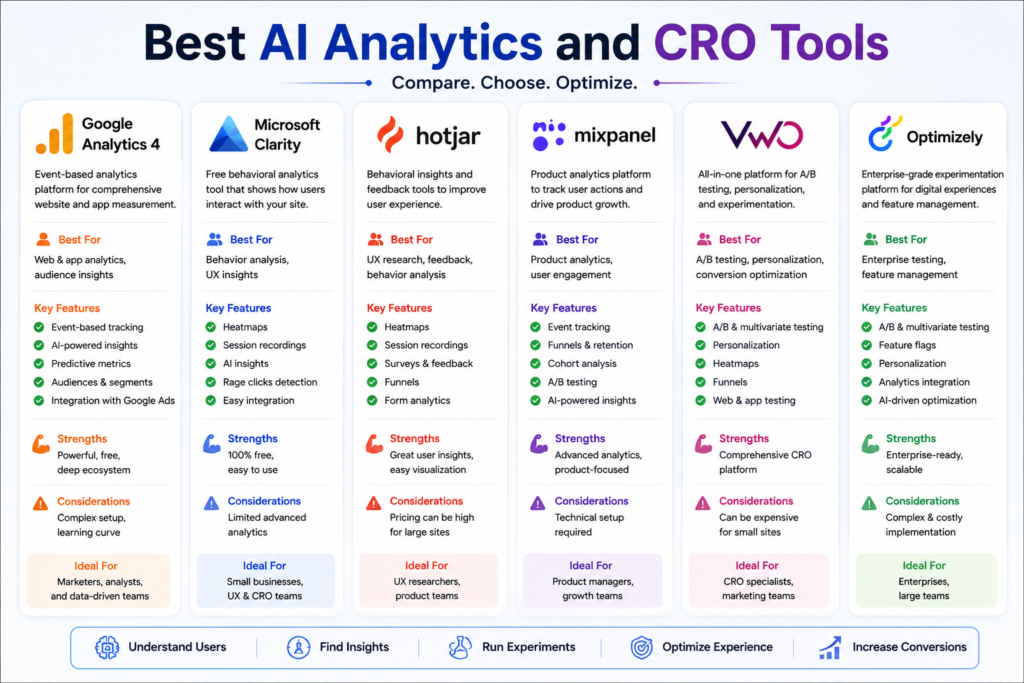
Quick Answer: There is no single best platform for every organization. Google Analytics and Mixpanel emphasize event and journey analysis. Clarity and Hotjar provide behavioral context. VWO and Optimizely support structured experimentation and personalization. The right choice depends on your traffic, technical resources, decision needs, existing data stack, and experimentation maturity.
Tool Comparison
Tool
Best For
Notable Capabilities
Considerations
Google Analytics 4
Website and ecommerce measurement
Event-based analytics, funnels, audiences and eligible predictive metrics (Google Help)
Requires disciplined configuration and event governance
Microsoft Clarity
Accessible behavioral analysis
Heatmaps, session recordings and AI-assisted insights; Microsoft presents Clarity as free with no traffic limit (Microsoft Learn)
Best used with a quantitative analytics platform
Hotjar
UX research and visitor feedback
Heatmaps, session replay, funnels, surveys and feedback tools (Hotjar)
Sampling, limits and available features depend on the current plan
Mixpanel
Product and journey analytics
Event analysis, flows, funnels, experimentation-related workflows and AI-assisted exploration (Mixpanel)
Requires a carefully designed tracking plan
VWO
Connected CRO and experimentation
Behavioral insights, testing, personalization, feature experimentation and AI-assisted hypothesis development (VWO)
May be more platform than a small site initially needs
Optimizely
Enterprise experimentation
Web and feature experimentation, feature flags, personalization and controlled rollouts (Optimizely)
Implementation usually requires technical and operational maturity
Features, limits, integrations, and prices may change over time. Check the vendor’s latest plan before you decide to buy.
Best Starter
For a new content site, lead-generation business, or small ecommerce store:
Google Analytics 4 for event and acquisition measurement
Microsoft Clarity for heatmaps and session investigation
A simple survey or customer-feedback tool
A spreadsheet or project board for hypothesis tracking
This setup is sufficient to begin identifying and prioritizing conversion problems without purchasing a full experimentation suite.
Best Growth-Stage Stack
For a growing ecommerce or software business:
GA4 or Mixpanel for quantitative analysis
Clarity or Hotjar for behavioral evidence
VWO or another testing platform for experiments
CRM and revenue-data integration
A centralized testing and learning repository
Best Enterprise Stack
An enterprise may require:
A customer data platform or data warehouse
Product and web analytics
Server-side experimentation
Feature-flag management
Personalization
Consent and identity controls
Automated data-quality monitoring
A formal experimentation governance process
The goal for an enterprise is not to gather as many tools as possible. Instead, focus on building a reliable decision-making system that works across teams.
How to Choose the Right Tool Stack
Quick Answer: Start with the business decisions you need to make, not a list of fashionable features. Evaluate whether each platform can collect trustworthy data, answer your priority questions, integrate with existing systems, support your experiment type, protect customer information, and produce insights your team can realistically act on.
Start With Decision Requirements
Before comparing vendors, document five to ten recurring decisions, such as:
Which landing page deserves optimization first?
Why are mobile users abandoning checkout?
Which acquisition channels generate profitable customers?
Which product features improve retention?
Does a redesigned form increase qualified leads?
Which visitor segments respond to a specific offer?
A platform is useful if it helps you answer these questions clearly and quickly.
Use a Weighted Evaluation Scorecard
Score each tool from 1 to 5, multiply the score by the assigned weight, and compare the totals.
Evaluation Area
Suggested Weight
Data accuracy and flexibility
20%
Experimentation capability
20%
Behavioral insight
15%
Integrations and data portability
15%
Privacy and governance
10%
AI transparency and usefulness
10%
Ease of implementation
5%
Total cost of ownership
5%
Adjust the weights according to your organization.
A content publisher may assign more weight to usability and attribution. A software company may prioritize product events and feature experimentation. An enterprise may give governance and integration significantly more weight.
Run a Real-World Proof of Concept
Do not evaluate a tool only through a sales demonstration.
Give each shortlisted platform the same assignment:
Identify a real funnel problem.
Segment affected users.
Provide supporting evidence.
Create a testable hypothesis.
Estimate the implementation effort.
Explain how success would be measured.
The best tool is the one that helps your team make solid decisions, not just the one with the most features listed.
Pro Tip: Measure time to evidence, not simply time to dashboard. A fast report has little value when the team still cannot decide what to do.
How to Implement an AI Analytics and CRO tools Process
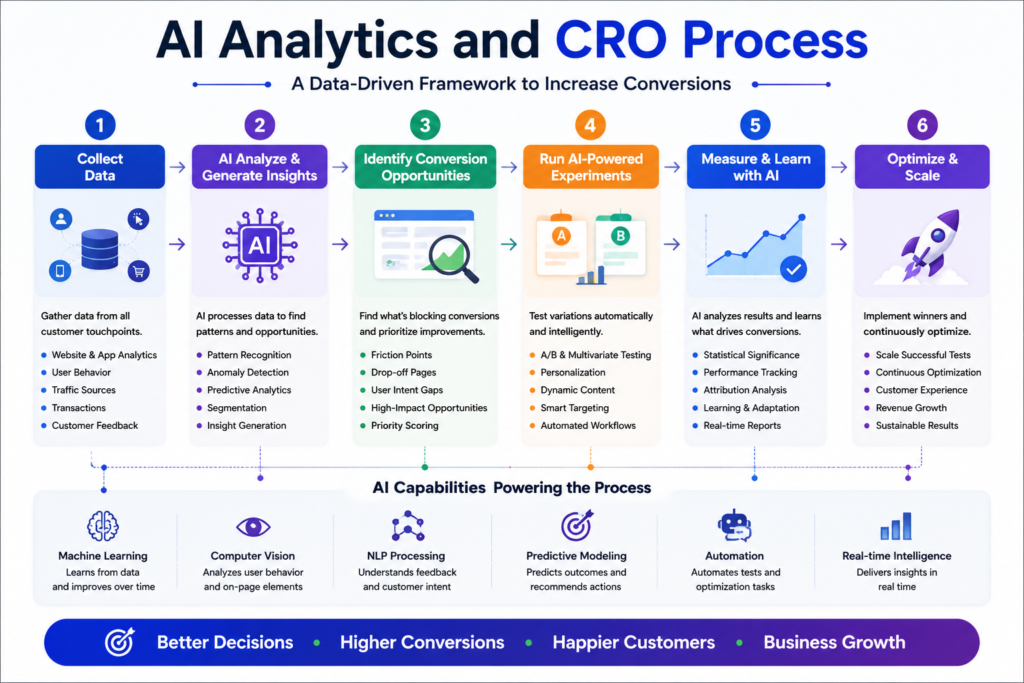
Quick Answer: A reliable CRO process begins with a business outcome, validates tracking, establishes a baseline, combines quantitative and qualitative evidence, prioritizes one hypothesis, runs an appropriately designed experiment, and records the result. AI can accelerate each step, but it should not replace data validation, customer context, or controlled measurement.
Step 1: Define the Business Outcome
Avoid beginning with “increase engagement.” Use a measurable result such as:
Increase completed purchases
Increase qualified demo requests
Reduce checkout errors
Increase trial-to-paid conversion
Improve repeat purchase rate
Reduce subscription cancellations
Separate the final business outcome from supporting behaviors.
For example:
Metric Type
Ecommerce Example
North-star outcome
Profit per eligible visitor
Primary conversion
Completed purchase
Supporting metric
Checkout-start rate
Diagnostic metric
Payment error rate
Guardrail metric
Refund rate
Step 2: Build a Tracking Plan
Your tracking plan should document:
Field
Example
Event name
begin_checkout
Trigger
Visitor opens the first checkout step
Required properties
Cart value, currency, device and product count
User scope
Anonymous or authenticated user
Business owner
Ecommerce manager
Technical owner
Analytics engineer
Validation method
Debug test and completed test order
Use consistent event names and definitions. Multiple teams should not use different terms for the same action.
Step 3: Validate the Data
Before trusting an AI-generated insight, confirm that:
Events fire at the correct moment
Important events are not duplicated
Revenue values use the right currency
Internal traffic is handled consistently
Test transactions are identifiable
Campaign parameters are preserved
Cross-domain journeys work correctly
Consent choices are respected
Bot activity is considered
Mobile and desktop behavior are both represented
If your data is poor, adding AI leads to faster bad advice.
Step 4: Establish a Baseline
Document the current performance before making any changes.
Include:
Date range
Audience definition
Traffic sources
Device mix
Conversion rate
Average order value
Revenue per visitor
Error rate
Refund or cancellation rate
Significant promotions or operational changes
Step 5: Use the Evidence Triangle
A conversion problem should ideally be supported by three evidence types.
Quantitative Evidence
What is happening?
Example: Mobile checkout completion is lower than desktop completion.
Behavioral Evidence
How is the problem occurring?
Example: Recordings show repeated taps on a non-clickable delivery-information element.
Voice-of-Customer Evidence
Why might it be occurring?
Example: Survey responses show uncertainty about delivery dates.
When all three point toward the same problem, the hypothesis becomes more credible.
Step 6: Write a Testable Hypothesis
Use this structure:
Because we observed [evidence], we believe [change] for [audience] will improve [primary metric]. We will monitor [guardrail metrics] to ensure the change does not create a harmful side effect.
Example:
Because mobile visitors repeatedly search for delivery information before leaving the cart, we believe displaying an estimated delivery date beside the checkout button will increase mobile checkout completion. We will monitor refunds, cancellations, and customer-support contacts.
Step 7: Prioritize the Hypothesis
A simple prioritization model can evaluate:
Impact: How valuable could the result be?
Evidence: How strongly is the problem supported?
Reach: How many qualified visitors are affected?
Effort: How much design and development work is required?
Risk: Could the change harm revenue, trust, accessibility, or operations?
The score does not make the decision for you. Instead, it helps your team see and discuss the assumptions behind your choices.
Step 8: Test, Learn, and Document
Every experiment record should include:
Hypothesis
Supporting evidence
Target audience
Variations
Primary metric
Guardrail metrics
Planned duration or stopping rule
Technical quality assurance
Result
Decision
Follow-up insight
An inconclusive test is still useful when it eliminates a weak assumption or improves the next hypothesis.
AI Analytics and CRO Tools Conversion Metrics
Quick Answer: Track metrics that connect user behavior to business value. Use one clearly defined primary outcome, a small group of diagnostic indicators, and guardrail metrics that detect harmful side effects. Avoid celebrating clicks or engagement when those behaviors do not improve revenue, qualified leads, retention, profitability, or customer success.
Essential CRO Metrics
Metric
Formula
What It Reveals
Conversion rate
Conversions ÷ eligible visitors × 100
Percentage completing the target action
Revenue per visitor
Revenue ÷ eligible visitors
Traffic value independent of conversion rate alone
Average order value
Revenue ÷ orders
Average purchase size
Add-to-cart rate
Add-to-cart users ÷ product viewers × 100
Product-page effectiveness
Cart-to-checkout rate
Checkout starters ÷ cart users × 100
Cart-page effectiveness
Checkout completion
Purchasers ÷ checkout starters × 100
Checkout friction
Lead qualification rate
Qualified leads ÷ total leads × 100
Lead quality
Trial activation rate
Activated users ÷ trial users × 100
Initial product value
Retention rate
Returning active users ÷ cohort size × 100
Continued customer value
Relative uplift
(Variant rate − control rate) ÷ control rate × 100
Relative experiment change
Choose the Correct Denominator
A site-wide conversion rate can be misleading.
For example, a product-page test should usually be evaluated among users who were eligible to see that product-page experience—not every visitor to the website.
Define:
Who qualified for the experiment
Whether measurement is user-based or session-based
How repeat visits are handled
How cross-device behavior is treated
Which traffic should be excluded
Use Guardrail Metrics
A variation may increase purchases while causing another problem.
Useful guardrails include:
Refund rate
Cancellation rate
Customer-support contact rate
Page-load performance
JavaScript error rate
Product return rate
Gross margin
Subscription churn
Accessibility issues
Do not pick a winner by looking only at the main metric. Always check the full picture.
AI Analytics and CRO tools for Ecommerce
Quick Answer: Ecommerce optimization should connect the entire journey—from product discovery and product evaluation to cart, checkout, delivery, and repeat purchase. AI can identify high-friction segments and recurring behavior, while CRO methods determine whether proposed improvements increase profitable orders without increasing refunds, cancellations, support demand, or customer dissatisfaction.
Baymard’s ecommerce research places the average cart-abandonment rate at approximately 70%, illustrating how much commercial intent can be lost before purchase completion. (Baymard Institute)
That number does not mean every abandoned cart represents a recoverable sale. Some visitors are comparing prices, saving products, or browsing without immediate purchase intent. The CRO objective is to identify avoidable friction among qualified shoppers.
Ecommerce Optimization Map
Journey Stage
Useful Signals
Potential CRO Action
Primary Metric
Landing page
Message mismatch, quick exits
Align content with campaign intent
Qualified product views
Category page
Filter use, zero-result searches
Improve filtering and sorting
Product discovery rate
Product page
Image interaction, review usage
Clarify value, sizing and delivery
Add-to-cart rate
Cart
Coupon hunting, shipping uncertainty
Show cost and delivery information
Checkout-start rate
Checkout
Form errors, repeated backtracking
Simplify fields and clarify errors
Checkout completion
Post-purchase
Support requests, cancellations
Improve confirmation and tracking
Cancellation rate
Retention
Reorder timing, category affinity
Personalize reminders and discovery
Repeat purchase rate
Product-Page Analysis
Use AI Analytics and CRO tools to compare:
Mobile and desktop visitors
New and returning customers
Paid and organic traffic
High- and low-priced products
In-stock and low-stock products
Products with and without reviews
Visitors who used search
Visitors who viewed delivery information
Behavioral evidence may reveal:
Important details appearing too far down the page
Images that visitors expect to enlarge
Confusing size or variation selectors
Weak visibility of return information
Accidental taps
Repeated interaction with unavailable options
Poor mobile placement of the add-to-cart button
Checkout Analysis
Break checkout into distinct stages:
Cart review
Account or guest selection
Shipping information
Delivery method
Payment
Order review
Confirmation
Looking at just one overall abandonment rate will not tell you which part of the process needs work.
The AI Confidence Ladder
Use this five-level framework before acting on an automated recommendation:
Level
Evidence
Recommended Action
1
AI-generated suggestion only
Investigate
2
Suggestion plus quantitative pattern
Review segments
3
Quantitative and behavioral evidence
Develop a hypothesis
4
Evidence plus customer feedback
Prioritize a test
5
Controlled experiment confirms impact
Implement and monitor
This helps teams avoid mistaking a good-sounding AI explanation for real proof of cause and effect.
A Human-AI CRO Operating Model
Quick Answer: The strongest operating model gives AI responsibility for pattern discovery, summarization, classification, and first-draft hypotheses. Humans remain responsible for strategy, customer context, ethics, prioritization, creative judgment, and quality assurance. Controlled experiments or carefully designed before-and-after evaluations remain responsible for determining whether a change produced the intended result.
What AI Should Do
AI is well suited to:
Summarizing large sets of feedback
Grouping similar session behaviors
Detecting unusual metric movements
Drafting test hypotheses
Suggesting audience segments
Converting findings into structured reports
Identifying repeated objections
Generating alternative copy concepts
Highlighting possible data-quality issues
What Humans Should Do
Human specialists should:
Select meaningful business outcomes
Determine whether the data is trustworthy
Understand operational constraints
Recognize customer sensitivities
Reject misleading correlations
Protect user privacy
Prioritize opportunities
Design credible experiments
Evaluate brand and accessibility implications
Approve implementation decisions
What Experiments Should Decide
Experiments should answer questions such as:
Did the variation increase the primary outcome?
Was the result consistent across important segments?
Did it create a negative guardrail effect?
Is the effect commercially meaningful?
Can the result be replicated?
Should the change be implemented, revised, or rejected?
Expert Quote Placeholder: “[Insert a quote from a CRO specialist explaining why AI-generated hypotheses must be validated with customer evidence and controlled measurement.]”
Measure Decision Latency
A useful operational metric is decision latency:
The time between detecting a meaningful problem and reaching an evidence-based decision about it.
AI may reduce analysis time, but decision latency remains high when:
Tracking cannot be trusted
No one owns the metric
Development queues are unclear
Tests require excessive approval
Findings are spread across multiple tools
Previous experiment results cannot be found
Optimizing the operating process may produce more value than purchasing another platform.
Common Mistakes to Avoid
Quick Answer: Common failures include collecting data without a decision plan, trusting AI summaries without reviewing the evidence, testing low-impact cosmetic changes, using inconsistent metrics, stopping experiments prematurely, ignoring mobile segments, and optimizing conversion rate at the expense of profitability or retention. Successful CRO requires disciplined measurement, prioritization, documentation, and organizational follow-through.
Mistake
Why It Fails
Better Approach
Installing too many tools
Creates duplicated data and conflicting reports
Assign each tool a defined purpose
Tracking everything
Produces noise and governance problems
Track decisions and meaningful behaviors
Accepting AI explanations as facts
Pattern recognition does not prove causation
Review evidence and test the hypothesis
Watching random recordings
Encourages anecdotal conclusions
Segment recordings around a defined problem
Testing button colors without evidence
Usually targets a weak opportunity
Begin with customer friction or value clarity
Using only conversion rate
Can hide changes in order value or quality
Include revenue and guardrail metrics
Ignoring sample composition
Changes in traffic can distort performance
Compare equivalent audiences
Running many overlapping tests
Makes effects difficult to attribute
Coordinate experiments and exposure
Ending tests when results look favorable
Increases decision risk
Define rules before launch
Failing to document losses
Causes teams to repeat failed ideas
Maintain a searchable learning repository
Personalizing too early
Scales an unvalidated assumption
Validate the base experience first
Optimizing only for acquisition
Misses retention and customer value
Measure the full customer lifecycle
Avoid Optimization Debt
Optimization debt occurs when a company runs many tests but fails to maintain the following:
Accurate documentation
Reusable components
Consistent metrics
Permanent implementation quality
Post-launch monitoring
A record of customer insights
The team appears busy, but its ability to learn becomes weaker over time.
30-Day AI Analytics and CRO Tools Action Plan
Quick Answer: In your first 30 days, focus on getting your measurements right, picking one key customer journey, and finding one optimization backed by evidence. Do not try to automate everything at once. Set up reliable tracking, analyze funnel steps, gather behavioral and customer feedback, choose a main hypothesis, and get ready to run a well-measured experiment.
Week 1: Measurement Foundation
Select one primary conversion journey.
Define the primary business outcome.
Audit existing analytics events.
Confirm revenue and conversion values.
Remove duplicate or unclear events.
Document the event taxonomy.
Verify mobile and desktop tracking.
Establish baseline metrics.
Deliverable: Approved measurement plan and baseline report.
Week 2: Friction Discovery
Build the journey funnel.
Segment by device and traffic source.
Identify the largest meaningful drop-off.
Review relevant heatmaps.
Watch a focused sample of sessions.
Collect survey or support-ticket evidence.
Use AI to group recurring observations.
Deliverable: Evidence summary containing three to five prioritized problems.
Week 3: Hypothesis Development
Convert observations into structured hypotheses.
Estimate reach and potential impact.
Assess implementation effort and risk.
Choose one primary hypothesis.
Define the primary and guardrail metrics.
Design the control and variation.
Complete technical and analytics quality assurance.
Deliverable: Experiment brief ready for launch.
Week 4: Launch and Governance
Launch the test or controlled change.
Monitor technical integrity.
Avoid making decisions from early fluctuations.
Document external factors such as campaigns or outages.
Create a central learning repository.
Schedule the result review.
Add follow-up opportunities to the roadmap.
Deliverable: Active experiment and repeatable CRO workflow.
Frequently Asked Questions
Quick Answer: Businesses commonly want to know which AI analytics platform is best, whether AI can automatically increase conversions, how much traffic testing requires, and whether free tools are sufficient. The correct answer usually depends on the organization’s measurement quality, traffic volume, business model, technical resources, and ability to act on evidence.
What Is the Best AI Analytics Tool?
Quick Answer: The best platform depends on your use case. Google Analytics is useful for broad website and acquisition measurement, while Mixpanel emphasizes event-based product journeys. Clarity and Hotjar provide behavioral context. Evaluate tools using your own tracking requirements, integrations, privacy needs, team skills, and recurring business decisions.
What Is the Best CRO Tool for Ecommerce?
Quick Answer: Ecommerce businesses usually need a combination rather than one tool. Use quantitative analytics to locate funnel losses, behavioral analytics to investigate friction, customer feedback to understand objections, and an experimentation platform to validate proposed improvements. The most appropriate vendor depends on traffic, platform compatibility, testing complexity, budget, and internal expertise.
Can AI Automatically Improve a Website’s Conversion Rate?
Quick Answer: AI can detect patterns, summarize behavior, generate ideas, and automate some personalization, but it cannot guarantee higher conversions. Recommendations may be based on incomplete data or misleading correlations. Important changes should be reviewed by a person and validated through controlled experiments or another credible measurement design before full implementation.
Is Google Analytics a CRO tool?
Quick Answer: Google Analytics is primarily a measurement and analysis platform rather than a complete CRO system. It can reveal traffic performance, events, funnels, audiences, and conversion patterns, but teams usually combine it with behavioral research, customer feedback, and experimentation tools to understand friction and verify whether proposed changes improve results.
What Is the Difference Between Web Analytics and CRO?
Quick Answer: Web analytics measures what visitors do, including where they arrive, which events they complete, and where they leave. CRO uses that data alongside behavioral research, customer feedback, and experiments to improve a specific business outcome. Analytics produces evidence; CRO turns evidence into prioritized changes and validated learning.
Do Small Websites Need A/B Testing?
Quick Answer: Small websites need optimization, but they may not always have enough eligible traffic for frequent conventional A/B tests. They can still improve through analytics audits, usability testing, surveys, customer interviews, message testing, and carefully monitored changes. The measurement method should match the traffic volume, risk, and expected effect size.
How Much Traffic Is Needed for a CRO Test?
Quick Answer: There is no universal traffic requirement. The required sample depends on the baseline conversion rate, minimum effect worth detecting, statistical approach, number of variations, traffic allocation, and acceptable uncertainty. Calculate requirements before launch and avoid choosing a sample size simply because another website used the same number.
Are AI-Generated CRO Recommendations Reliable?
Quick Answer: AI recommendations are useful starting points, not final proof. Reliability depends on tracking accuracy, data volume, segment relevance, model design, and the evidence shown with the recommendation. Review the underlying sessions, events, feedback, and business context. Use experimentation to determine whether the suggested change causes a meaningful improvement.
Which Metrics Matter Most for Ecommerce CRO?
Quick Answer: Important ecommerce metrics include revenue per eligible visitor, purchase conversion rate, add-to-cart rate, checkout-start rate, checkout completion, average order value, gross margin, refund rate, cancellation rate, and repeat purchase rate. Select one primary outcome and use supporting and guardrail metrics to explain both benefits and possible harm.
Can I Start With Free Analytics and CRO Tools?
Quick Answer: Yes. A small business can begin with a basic analytics platform, Microsoft Clarity, customer surveys, and a documented optimization process. Paid tools become more valuable when the business needs advanced experimentation, deeper segmentation, more integrations, longer retention, collaboration workflows, stronger governance, or support for higher traffic and organizational complexity.
How Often Should a Business Review CRO Data?
Quick Answer: Technical alerts and serious conversion changes may require daily monitoring, while strategic funnel and experiment reviews are often more useful weekly or biweekly. Broader roadmap and customer-journey reviews can be conducted monthly or quarterly. Choose a schedule that enables action without encouraging teams to react to ordinary short-term variation.
Will AI Replace CRO Specialists?
Quick Answer: AI is more likely to change CRO work than eliminate it. It can accelerate analysis, summarization, segmentation, and idea generation. Specialists are still needed to choose meaningful problems, evaluate evidence, understand customer context, design valid experiments, manage risk, interpret results, and translate findings into commercially and ethically sound decisions.
Final Verdict
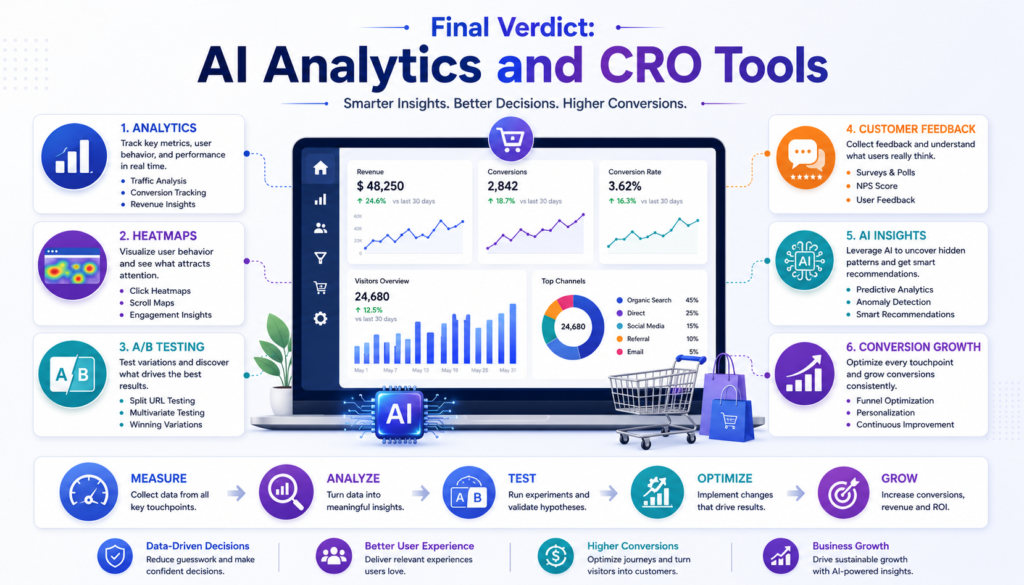
Quick Answer: AI analytics and CRO tools work best when they come together as one evidence system. Use analytics to find problems, behavioral research to understand what is happening, customer feedback to learn why, and experiments to test solutions. Let AI speed up discovery, but keep people in charge of judgment, oversight, and final choices.
The most effective conversion stack is not the one with the greatest number of dashboards or automated recommendations. It is the one that repeatedly helps your team answer four questions:
Where is meaningful performance being lost?
What evidence explains the problem?
Which proposed solution deserves testing?
Did the change create a valuable and sustainable outcome?
Begin with a reliable measurement and one important customer journey. Add behavioral evidence. Listen to customers. Prioritize a testable hypothesis. Measure the result with a primary metric and appropriate guardrails.
In 2026, AI can make this process much faster. But the real advantage comes from using that speed to make careful, customer-focused decisions.
About the Author
AI Ecommerce Tools Editorial Team
This guide was researched, reviewed, and maintained by the AI Ecommerce Tools Editorial Team. Our mission is to help businesses, marketers, ecommerce brands, agencies, and content creators choose the best AI software through practical testing, unbiased comparisons, and regularly updated educational resources.
We evaluate AI tools based on usability, features, pricing, integrations, performance, and real-world marketing value. Our content is updated frequently to reflect new product releases, feature enhancements, pricing changes, and emerging industry trends.
Editorial Standards
Independent and research-driven reviews
Practical recommendations based on real use cases
Regular content updates
Focus on SEO, AEO, GEO, and E-E-A-T best practices.
Commitment to accuracy, transparency, and user value
Editorial Note: This article was last reviewed in August 2026. We recommend revisiting this guide periodically, as AI marketing tools and features evolve rapidly.
Disclaimer
This content is provided for educational and informational purposes only. While we strive to keep all information accurate and up to date, AI software features, pricing, integrations, and availability may change over time. Always verify the latest information on the official website before making purchasing or business decisions.
How We Evaluate AI Tools
Every AI tool featured on AI Ecommerce Tools is evaluated using a consistent editorial methodology. We assess products based on:
Features & capabilities
Ease of use
Pricing & overall value
Integrations
Customer support
Security & privacy
Real-world business use cases
Performance and reliability
Our goal is to provide objective, research-based recommendations rather than promotional rankings.
Content Update Policy
We review this guide regularly to ensure accuracy. Whenever major AI platforms release new features, pricing updates, or significant improvements, this article is revised accordingly to keep readers informed with the latest information.
Share This Guide
If this guide was helpful, please share it with your colleagues, marketing team, or other business owners. Sharing reliable AI resources helps everyone make smarter choices about using artificial intelligence.
Thank you for reading!
We hope this guide helps you choose the best AI marketing tools for your business with confidence. As AI keeps changing, we’ll work to keep this resource accurate, practical, and current so you can make smart marketing decisions.
Purchasing a product
Requesting a quote
Booking a consultation
Creating an account
Starting a free trial
Subscribing to a newsletter
Completing an onboarding step
AI Analytics vs. Traditional Analytics
Traditional analytics usually requires the user to decide what report to open, which segment to examine, and what pattern to investigate.
AI-assisted analytics can help by:
Detecting unexpected increases or decreases Summarizing complex reports Predicting purchase or churn probability Grouping similar customer behaviors Identifying likely conversion barriers Suggesting questions or test ideas Allowing users to query data in natural language
Google Analytics, for example, uses machine learning to generate predictive metrics such as purchase probability, churn probability, and predicted revenue when a property meets the applicable data requirements. (Google Help)
AI Analytics and CRO tools Solve Different Problems
Discipline
Primary Question
Typical Output
Web analytics
What happened?
Traffic, events, revenue and funnel reports
Behavioral analytics
How did visitors interact?
Heatmaps, recordings and journey patterns
Customer research
Why did it happen?
Survey responses, interviews and objections
Predictive analytics
What may happen next?
Propensity scores, forecasts and risk alerts
Experimentation
Did the proposed change work?
Measured uplift, loss or inconclusive result
Personalization
Which experience fits this visitor?
Segment-specific content or offers
A strong optimization program uses all six layers rather than relying on one dashboard.
How AI Is Changing AI Analytics and CRO tools
Quick Answer: In 2026, AI is reducing the time required to move from raw behavioral data to a testable hypothesis. Modern platforms can summarize sessions, detect anomalies, answer natural-language questions, predict outcomes, and generate experiment ideas. Human judgment is still required to validate context, business relevance, data quality, and statistical evidence.
Faster Insight Discovery
A marketer may have thousands of customer journeys, event combinations, and session recordings to examine. AI Analytics and CRO tools can reduce this workload by grouping related behavior and summarizing recurring patterns. Microsoft Clarity, for example, offers AI-assisted session insights, while its grouped insights capability can summarize multiple recordings filtered by attributes such as device, events, campaign, or visited page. (Microsoft Learn)
This does not mean the AI has established the cause of a conversion problem. It means the system has helped identify where a human should investigate.
Natural-Language Data Exploration
Instead of building every report manually, teams can increasingly ask questions such as:
Which acquisition channel produced the most repeat purchasers?
Where do mobile visitors leave the checkout?
Which product features correlate with higher retention?
Did the new pricing page change demo requests?
What behavior is common among high-value customers?
Natural-language interfaces make analytics more accessible, but the quality of the answer still depends on accurate event tracking, naming conventions, attribution logic, and data governance.
Predictive Segmentation
Predictive systems can identify visitors who are more likely to purchase, churn, upgrade, or return.
These predictions may support:
Retargeting audiences
Email prioritization
Personalized product recommendations
Customer-success interventions
Promotional suppression
High-intent audience analysis
A predictive score should be treated as a probability, not a guarantee.
Automated Hypothesis Generation
AI can transform observations into structured test ideas. For example:
Observation: Mobile visitors frequently return to the shipping-information section. Possible AI-generated hypothesis: Visitors may not understand delivery costs or arrival dates before checkout. Potential test: Display estimated delivery dates and shipping thresholds directly on product pages. Primary metric: Product-to-checkout rate. Guardrail metric: Refund or cancellation rate.
The system accelerates ideation, but the optimization team must decide whether the hypothesis is logical, technically feasible, ethical, and valuable enough to test.
Essential AI Analytics and CRO Tools Capabilities
Quick Answer: The best platform is not always the one with the most AI features. Pick tools that offer reliable data, useful segmentation, clear behavioral context, good experiment tracking, helpful integrations, strong privacy controls, and transparent results. AI should help you analyze faster, but not hide how it reached its conclusions or push changes that have not been checked.
Core Capability Checklist
Capability
What It Should Help You Do
Warning Sign
Event analytics
Measure important customer actions
Tracking only pageviews
Funnel analysis
Locate major journey drop-offs
Inconsistent funnel definitions
Segmentation
Compare meaningful audience groups
Too many unused segments
Heatmaps
See aggregate clicks and scrolling
Treating visual activity as intent
Session replay
Investigate individual experiences
Recording sensitive information
Surveys and feedback
Understand motivations and objections
Asking biased questions
Anomaly detection
Find unusual changes quickly
Alerting without business context
Predictive analysis
Estimate future behavior
Presenting probability as certainty
A/B testing
Measure causal impact
Stopping tests when results look positive
Personalization
Tailor experiences by segment
Creating experiences without validation
AI summaries
Reduce manual review time
Summaries without links to evidence
Integrations
Connect marketing, product and revenue data
Isolated dashboards
Governance
Maintain consistent definitions and access
Uncontrolled event creation
Transparent AI Outputs
A useful AI-generated insight should show:
The observation: What pattern was detected?
The segment: Which visitors were affected?
The timeframe: When did the behavior occur?
The evidence: Which sessions, events, or reports support it?
The confidence: How strong or consistent is the pattern?
The next action: What should a person investigate or test?
Avoid tools that make strong recommendations but do not show the evidence behind them. Privacy and Data Controls
Privacy and Data Controls
Your platform should support appropriate controls for:
Personally identifiable information
Form-field masking
Consent management
Data retention
User access
Data deletion
Geographic storage requirements
Internal governance
Always set up analytics and replay tools to follow the law, your company’s policies, and the latest instructions from the platform.
Best AI Analytics and CRO Tools by Use Case
Quick Answer: There is no single best platform for every organization. Google Analytics and Mixpanel emphasize event and journey analysis. Clarity and Hotjar provide behavioral context. VWO and Optimizely support structured experimentation and personalization. The right choice depends on your traffic, technical resources, decision needs, existing data stack, and experimentation maturity.
Tool Comparison
Tool
Best For
Notable Capabilities
Considerations
Google Analytics 4
Website and ecommerce measurement
Event-based analytics, funnels, audiences and eligible predictive metrics (Google Help)
Requires disciplined configuration and event governance
Microsoft Clarity
Accessible behavioral analysis
Heatmaps, session recordings and AI-assisted insights; Microsoft presents Clarity as free with no traffic limit (Microsoft Learn)
Best used with a quantitative analytics platform
Hotjar
UX research and visitor feedback
Heatmaps, session replay, funnels, surveys and feedback tools (Hotjar)
Sampling, limits and available features depend on the current plan
Mixpanel
Product and journey analytics
Event analysis, flows, funnels, experimentation-related workflows and AI-assisted exploration (Mixpanel)
Requires a carefully designed tracking plan
VWO
Connected CRO and experimentation
Behavioral insights, testing, personalization, feature experimentation and AI-assisted hypothesis development (VWO)
May be more platform than a small site initially needs
Optimizely
Enterprise experimentation
Web and feature experimentation, feature flags, personalization and controlled rollouts (Optimizely)
Implementation usually requires technical and operational maturity
Features, limits, integrations, and prices may change over time. Check the vendor’s latest plan before you decide to buy.
Best Starter
For a new content site, lead-generation business, or small ecommerce store:
Google Analytics 4 for event and acquisition measurement
Microsoft Clarity for heatmaps and session investigation
A simple survey or customer-feedback tool
A spreadsheet or project board for hypothesis tracking
This setup is sufficient to begin identifying and prioritizing conversion problems without purchasing a full experimentation suite.
Best Growth-Stage Stack
For a growing ecommerce or software business:
GA4 or Mixpanel for quantitative analysis
Clarity or Hotjar for behavioral evidence
VWO or another testing platform for experiments
CRM and revenue-data integration
A centralized testing and learning repository
Best Enterprise Stack
An enterprise may require:
A customer data platform or data warehouse
Product and web analytics
Server-side experimentation
Feature-flag management
Personalization
Consent and identity controls
Automated data-quality monitoring
A formal experimentation governance process
The goal for an enterprise is not to gather as many tools as possible. Instead, focus on building a reliable decision-making system that works across teams.
How to Choose the Right Tool Stack
Quick Answer: Start with the business decisions you need to make, not a list of fashionable features. Evaluate whether each platform can collect trustworthy data, answer your priority questions, integrate with existing systems, support your experiment type, protect customer information, and produce insights your team can realistically act on.
Start With Decision Requirements
Before comparing vendors, document five to ten recurring decisions, such as:
Which landing page deserves optimization first?
Why are mobile users abandoning checkout?
Which acquisition channels generate profitable customers?
Which product features improve retention?
Does a redesigned form increase qualified leads?
Which visitor segments respond to a specific offer?
A platform is useful if it helps you answer these questions clearly and quickly.
Use a Weighted Evaluation Scorecard
Score each tool from 1 to 5, multiply the score by the assigned weight, and compare the totals.
Evaluation Area
Suggested Weight
Data accuracy and flexibility
20%
Experimentation capability
20%
Behavioral insight
15%
Integrations and data portability
15%
Privacy and governance
10%
AI transparency and usefulness
10%
Ease of implementation
5%
Total cost of ownership
5%
Adjust the weights according to your organization.
A content publisher may assign more weight to usability and attribution. A software company may prioritize product events and feature experimentation. An enterprise may give governance and integration significantly more weight.
Run a Real-World Proof of Concept
Do not evaluate a tool only through a sales demonstration.
Give each shortlisted platform the same assignment:
Identify a real funnel problem.
Segment affected users.
Provide supporting evidence.
Create a testable hypothesis.
Estimate the implementation effort.
Explain how success would be measured.
The best tool is the one that helps your team make solid decisions, not just the one with the most features listed.
Pro Tip: Measure time to evidence, not simply time to dashboard. A fast report has little value when the team still cannot decide what to do.
How to Implement an AI Analytics and CRO tools Process
Quick Answer: A reliable CRO process begins with a business outcome, validates tracking, establishes a baseline, combines quantitative and qualitative evidence, prioritizes one hypothesis, runs an appropriately designed experiment, and records the result. AI can accelerate each step, but it should not replace data validation, customer context, or controlled measurement.
Step 1: Define the Business Outcome
Avoid beginning with “increase engagement.” Use a measurable result such as:
Increase completed purchases
Increase qualified demo requests
Reduce checkout errors
Increase trial-to-paid conversion
Improve repeat purchase rate
Reduce subscription cancellations
Separate the final business outcome from supporting behaviors.
For example:
Metric Type
Ecommerce Example
North-star outcome
Profit per eligible visitor
Primary conversion
Completed purchase
Supporting metric
Checkout-start rate
Diagnostic metric
Payment error rate
Guardrail metric
Refund rate
Step 2: Build a Tracking Plan
Your tracking plan should document:
Field
Example
Event name
begin_checkout
Trigger
Visitor opens the first checkout step
Required properties
Cart value, currency, device and product count
User scope
Anonymous or authenticated user
Business owner
Ecommerce manager
Technical owner
Analytics engineer
Validation method
Debug test and completed test order
Use consistent event names and definitions. Multiple teams should not use different terms for the same action.
Step 3: Validate the Data
Before trusting an AI-generated insight, confirm that:
Events fire at the correct moment
Important events are not duplicated
Revenue values use the right currency
Internal traffic is handled consistently
Test transactions are identifiable
Campaign parameters are preserved
Cross-domain journeys work correctly
Consent choices are respected
Bot activity is considered
Mobile and desktop behavior are both represented
If your data is poor, adding AI leads to faster bad advice.
Step 4: Establish a Baseline
Document the current performance before making any changes.
Include:
Date range
Audience definition
Traffic sources
Device mix
Conversion rate
Average order value
Revenue per visitor
Error rate
Refund or cancellation rate
Significant promotions or operational changes
Step 5: Use the Evidence Triangle
A conversion problem should ideally be supported by three evidence types.
Quantitative Evidence
What is happening?
Example: Mobile checkout completion is lower than desktop completion.
Behavioral Evidence
How is the problem occurring?
Example: Recordings show repeated taps on a non-clickable delivery-information element.
Voice-of-Customer Evidence
Why might it be occurring?
Example: Survey responses show uncertainty about delivery dates.
When all three point toward the same problem, the hypothesis becomes more credible.
Step 6: Write a Testable Hypothesis
Use this structure:
Because we observed [evidence], we believe [change] for [audience] will improve [primary metric]. We will monitor [guardrail metrics] to ensure the change does not create a harmful side effect.
Example:
Because mobile visitors repeatedly search for delivery information before leaving the cart, we believe displaying an estimated delivery date beside the checkout button will increase mobile checkout completion. We will monitor refunds, cancellations, and customer-support contacts.
Step 7: Prioritize the Hypothesis
A simple prioritization model can evaluate:
Impact: How valuable could the result be?
Evidence: How strongly is the problem supported?
Reach: How many qualified visitors are affected?
Effort: How much design and development work is required?
Risk: Could the change harm revenue, trust, accessibility, or operations?
The score does not make the decision for you. Instead, it helps your team see and discuss the assumptions behind your choices.
Step 8: Test, Learn, and Document
Every experiment record should include:
Hypothesis
Supporting evidence
Target audience
Variations
Primary metric
Guardrail metrics
Planned duration or stopping rule
Technical quality assurance
Result
Decision
Follow-up insight
An inconclusive test is still useful when it eliminates a weak assumption or improves the next hypothesis.
AI Analytics and CRO Tools Conversion Metrics
Quick Answer: Track metrics that connect user behavior to business value. Use one clearly defined primary outcome, a small group of diagnostic indicators, and guardrail metrics that detect harmful side effects. Avoid celebrating clicks or engagement when those behaviors do not improve revenue, qualified leads, retention, profitability, or customer success.
Essential CRO Metrics
Metric
Formula
What It Reveals
Conversion rate
Conversions ÷ eligible visitors × 100
Percentage completing the target action
Revenue per visitor
Revenue ÷ eligible visitors
Traffic value independent of conversion rate alone
Average order value
Revenue ÷ orders
Average purchase size
Add-to-cart rate
Add-to-cart users ÷ product viewers × 100
Product-page effectiveness
Cart-to-checkout rate
Checkout starters ÷ cart users × 100
Cart-page effectiveness
Checkout completion
Purchasers ÷ checkout starters × 100
Checkout friction
Lead qualification rate
Qualified leads ÷ total leads × 100
Lead quality
Trial activation rate
Activated users ÷ trial users × 100
Initial product value
Retention rate
Returning active users ÷ cohort size × 100
Continued customer value
Relative uplift
(Variant rate − control rate) ÷ control rate × 100
Relative experiment change
Choose the Correct Denominator
A site-wide conversion rate can be misleading.
For example, a product-page test should usually be evaluated among users who were eligible to see that product-page experience—not every visitor to the website.
Define:
Who qualified for the experiment
Whether measurement is user-based or session-based
How repeat visits are handled
How cross-device behavior is treated
Which traffic should be excluded
Use Guardrail Metrics
A variation may increase purchases while causing another problem.
Useful guardrails include:
Refund rate
Cancellation rate
Customer-support contact rate
Page-load performance
JavaScript error rate
Product return rate
Gross margin
Subscription churn
Accessibility issues
Do not pick a winner by looking only at the main metric. Always check the full picture.
AI Analytics and CRO tools for Ecommerce
Quick Answer: Ecommerce optimization should connect the entire journey—from product discovery and product evaluation to cart, checkout, delivery, and repeat purchase. AI can identify high-friction segments and recurring behavior, while CRO methods determine whether proposed improvements increase profitable orders without increasing refunds, cancellations, support demand, or customer dissatisfaction.
Baymard’s ecommerce research places the average cart-abandonment rate at approximately 70%, illustrating how much commercial intent can be lost before purchase completion. (Baymard Institute)
That number does not mean every abandoned cart represents a recoverable sale. Some visitors are comparing prices, saving products, or browsing without immediate purchase intent. The CRO objective is to identify avoidable friction among qualified shoppers.
Ecommerce Optimization Map
Journey Stage
Useful Signals
Potential CRO Action
Primary Metric
Landing page
Message mismatch, quick exits
Align content with campaign intent
Qualified product views
Category page
Filter use, zero-result searches
Improve filtering and sorting
Product discovery rate
Product page
Image interaction, review usage
Clarify value, sizing and delivery
Add-to-cart rate
Cart
Coupon hunting, shipping uncertainty
Show cost and delivery information
Checkout-start rate
Checkout
Form errors, repeated backtracking
Simplify fields and clarify errors
Checkout completion
Post-purchase
Support requests, cancellations
Improve confirmation and tracking
Cancellation rate
Retention
Reorder timing, category affinity
Personalize reminders and discovery
Repeat purchase rate
Product-Page Analysis
Use AI Analytics and CRO tools to compare:
Mobile and desktop visitors
New and returning customers
Paid and organic traffic
High- and low-priced products
In-stock and low-stock products
Products with and without reviews
Visitors who used search
Visitors who viewed delivery information
Behavioral evidence may reveal:
Important details appearing too far down the page
Images that visitors expect to enlarge
Confusing size or variation selectors
Weak visibility of return information
Accidental taps
Repeated interaction with unavailable options
Poor mobile placement of the add-to-cart button
Checkout Analysis
Break checkout into distinct stages:
Cart review
Account or guest selection
Shipping information
Delivery method
Payment
Order review
Confirmation
Looking at just one overall abandonment rate will not tell you which part of the process needs work.
The AI Confidence Ladder
Use this five-level framework before acting on an automated recommendation:
Level
Evidence
Recommended Action
1
AI-generated suggestion only
Investigate
2
Suggestion plus quantitative pattern
Review segments
3
Quantitative and behavioral evidence
Develop a hypothesis
4
Evidence plus customer feedback
Prioritize a test
5
Controlled experiment confirms impact
Implement and monitor
This helps teams avoid mistaking a good-sounding AI explanation for real proof of cause and effect.
A Human-AI CRO Operating Model
Quick Answer: The strongest operating model gives AI responsibility for pattern discovery, summarization, classification, and first-draft hypotheses. Humans remain responsible for strategy, customer context, ethics, prioritization, creative judgment, and quality assurance. Controlled experiments or carefully designed before-and-after evaluations remain responsible for determining whether a change produced the intended result.
What AI Should Do
AI is well suited to:
Summarizing large sets of feedback
Grouping similar session behaviors
Detecting unusual metric movements
Drafting test hypotheses
Suggesting audience segments
Converting findings into structured reports
Identifying repeated objections
Generating alternative copy concepts
Highlighting possible data-quality issues
What Humans Should Do
Human specialists should:
Select meaningful business outcomes
Determine whether the data is trustworthy
Understand operational constraints
Recognize customer sensitivities
Reject misleading correlations
Protect user privacy
Prioritize opportunities
Design credible experiments
Evaluate brand and accessibility implications
Approve implementation decisions
What Experiments Should Decide
Experiments should answer questions such as:
Did the variation increase the primary outcome?
Was the result consistent across important segments?
Did it create a negative guardrail effect?
Is the effect commercially meaningful?
Can the result be replicated?
Should the change be implemented, revised, or rejected?
Expert Quote Placeholder: “[Insert a quote from a CRO specialist explaining why AI-generated hypotheses must be validated with customer evidence and controlled measurement.]”
Measure Decision Latency
A useful operational metric is decision latency:
The time between detecting a meaningful problem and reaching an evidence-based decision about it.
AI may reduce analysis time, but decision latency remains high when:
Tracking cannot be trusted
No one owns the metric
Development queues are unclear
Tests require excessive approval
Findings are spread across multiple tools
Previous experiment results cannot be found
Optimizing the operating process may produce more value than purchasing another platform.
Common Mistakes to Avoid
Quick Answer: Common failures include collecting data without a decision plan, trusting AI summaries without reviewing the evidence, testing low-impact cosmetic changes, using inconsistent metrics, stopping experiments prematurely, ignoring mobile segments, and optimizing conversion rate at the expense of profitability or retention. Successful CRO requires disciplined measurement, prioritization, documentation, and organizational follow-through.
Mistake
Why It Fails
Better Approach
Installing too many tools
Creates duplicated data and conflicting reports
Assign each tool a defined purpose
Tracking everything
Produces noise and governance problems
Track decisions and meaningful behaviors
Accepting AI explanations as facts
Pattern recognition does not prove causation
Review evidence and test the hypothesis
Watching random recordings
Encourages anecdotal conclusions
Segment recordings around a defined problem
Testing button colors without evidence
Usually targets a weak opportunity
Begin with customer friction or value clarity
Using only conversion rate
Can hide changes in order value or quality
Include revenue and guardrail metrics
Ignoring sample composition
Changes in traffic can distort performance
Compare equivalent audiences
Running many overlapping tests
Makes effects difficult to attribute
Coordinate experiments and exposure
Ending tests when results look favorable
Increases decision risk
Define rules before launch
Failing to document losses
Causes teams to repeat failed ideas
Maintain a searchable learning repository
Personalizing too early
Scales an unvalidated assumption
Validate the base experience first
Optimizing only for acquisition
Misses retention and customer value
Measure the full customer lifecycle
Avoid Optimization Debt
Optimization debt occurs when a company runs many tests but fails to maintain the following:
Accurate documentation
Reusable components
Consistent metrics
Permanent implementation quality
Post-launch monitoring
A record of customer insights
The team appears busy, but its ability to learn becomes weaker over time.
30-Day AI Analytics and CRO Tools Action Plan
Quick Answer: In your first 30 days, focus on getting your measurements right, picking one key customer journey, and finding one optimization backed by evidence. Do not try to automate everything at once. Set up reliable tracking, analyze funnel steps, gather behavioral and customer feedback, choose a main hypothesis, and get ready to run a well-measured experiment.
Week 1: Measurement Foundation
Select one primary conversion journey.
Define the primary business outcome.
Audit existing analytics events.
Confirm revenue and conversion values.
Remove duplicate or unclear events.
Document the event taxonomy.
Verify mobile and desktop tracking.
Establish baseline metrics.
Deliverable: Approved measurement plan and baseline report.
Week 2: Friction Discovery
Build the journey funnel.
Segment by device and traffic source.
Identify the largest meaningful drop-off.
Review relevant heatmaps.
Watch a focused sample of sessions.
Collect survey or support-ticket evidence.
Use AI to group recurring observations.
Deliverable: Evidence summary containing three to five prioritized problems.
Week 3: Hypothesis Development
Convert observations into structured hypotheses.
Estimate reach and potential impact.
Assess implementation effort and risk.
Choose one primary hypothesis.
Define the primary and guardrail metrics.
Design the control and variation.
Complete technical and analytics quality assurance.
Deliverable: Experiment brief ready for launch.
Week 4: Launch and Governance
Launch the test or controlled change.
Monitor technical integrity.
Avoid making decisions from early fluctuations.
Document external factors such as campaigns or outages.
Create a central learning repository.
Schedule the result review.
Add follow-up opportunities to the roadmap.
Deliverable: Active experiment and repeatable CRO workflow.
Frequently Asked Questions
Quick Answer: Businesses commonly want to know which AI analytics platform is best, whether AI can automatically increase conversions, how much traffic testing requires, and whether free tools are sufficient. The correct answer usually depends on the organization’s measurement quality, traffic volume, business model, technical resources, and ability to act on evidence.
What Is the Best AI Analytics Tool?
Quick Answer: The best platform depends on your use case. Google Analytics is useful for broad website and acquisition measurement, while Mixpanel emphasizes event-based product journeys. Clarity and Hotjar provide behavioral context. Evaluate tools using your own tracking requirements, integrations, privacy needs, team skills, and recurring business decisions.
What Is the Best CRO Tool for Ecommerce?
Quick Answer: Ecommerce businesses usually need a combination rather than one tool. Use quantitative analytics to locate funnel losses, behavioral analytics to investigate friction, customer feedback to understand objections, and an experimentation platform to validate proposed improvements. The most appropriate vendor depends on traffic, platform compatibility, testing complexity, budget, and internal expertise.
Can AI Automatically Improve a Website’s Conversion Rate?
Quick Answer: AI can detect patterns, summarize behavior, generate ideas, and automate some personalization, but it cannot guarantee higher conversions. Recommendations may be based on incomplete data or misleading correlations. Important changes should be reviewed by a person and validated through controlled experiments or another credible measurement design before full implementation.
Is Google Analytics a CRO tool?
Quick Answer: Google Analytics is primarily a measurement and analysis platform rather than a complete CRO system. It can reveal traffic performance, events, funnels, audiences, and conversion patterns, but teams usually combine it with behavioral research, customer feedback, and experimentation tools to understand friction and verify whether proposed changes improve results.
What Is the Difference Between Web Analytics and CRO?
Quick Answer: Web analytics measures what visitors do, including where they arrive, which events they complete, and where they leave. CRO uses that data alongside behavioral research, customer feedback, and experiments to improve a specific business outcome. Analytics produces evidence; CRO turns evidence into prioritized changes and validated learning.
Do Small Websites Need A/B Testing?
Quick Answer: Small websites need optimization, but they may not always have enough eligible traffic for frequent conventional A/B tests. They can still improve through analytics audits, usability testing, surveys, customer interviews, message testing, and carefully monitored changes. The measurement method should match the traffic volume, risk, and expected effect size.
How Much Traffic Is Needed for a CRO Test?
Quick Answer: There is no universal traffic requirement. The required sample depends on the baseline conversion rate, minimum effect worth detecting, statistical approach, number of variations, traffic allocation, and acceptable uncertainty. Calculate requirements before launch and avoid choosing a sample size simply because another website used the same number.
Are AI-Generated CRO Recommendations Reliable?
Quick Answer: AI recommendations are useful starting points, not final proof. Reliability depends on tracking accuracy, data volume, segment relevance, model design, and the evidence shown with the recommendation. Review the underlying sessions, events, feedback, and business context. Use experimentation to determine whether the suggested change causes a meaningful improvement.
Which Metrics Matter Most for Ecommerce CRO?
Quick Answer: Important ecommerce metrics include revenue per eligible visitor, purchase conversion rate, add-to-cart rate, checkout-start rate, checkout completion, average order value, gross margin, refund rate, cancellation rate, and repeat purchase rate. Select one primary outcome and use supporting and guardrail metrics to explain both benefits and possible harm.
Can I Start With Free Analytics and CRO Tools?
Quick Answer: Yes. A small business can begin with a basic analytics platform, Microsoft Clarity, customer surveys, and a documented optimization process. Paid tools become more valuable when the business needs advanced experimentation, deeper segmentation, more integrations, longer retention, collaboration workflows, stronger governance, or support for higher traffic and organizational complexity.
How Often Should a Business Review CRO Data?
Quick Answer: Technical alerts and serious conversion changes may require daily monitoring, while strategic funnel and experiment reviews are often more useful weekly or biweekly. Broader roadmap and customer-journey reviews can be conducted monthly or quarterly. Choose a schedule that enables action without encouraging teams to react to ordinary short-term variation.
Will AI Replace CRO Specialists?
Quick Answer: AI is more likely to change CRO work than eliminate it. It can accelerate analysis, summarization, segmentation, and idea generation. Specialists are still needed to choose meaningful problems, evaluate evidence, understand customer context, design valid experiments, manage risk, interpret results, and translate findings into commercially and ethically sound decisions.
Final Verdict
Quick Answer: AI analytics and CRO tools work best when they come together as one evidence system. Use analytics to find problems, behavioral research to understand what is happening, customer feedback to learn why, and experiments to test solutions. Let AI speed up discovery, but keep people in charge of judgment, oversight, and final choices.
The most effective conversion stack is not the one with the greatest number of dashboards or automated recommendations. It is the one that repeatedly helps your team answer four questions:
Where is meaningful performance being lost?
What evidence explains the problem?
Which proposed solution deserves testing?
Did the change create a valuable and sustainable outcome?
Begin with a reliable measurement and one important customer journey. Add behavioral evidence. Listen to customers. Prioritize a testable hypothesis. Measure the result with a primary metric and appropriate guardrails.
In 2026, AI can make this process much faster. But the real advantage comes from using that speed to make careful, customer-focused decisions.
About the Author
AI Ecommerce Tools Editorial Team
This guide was researched, reviewed, and maintained by the AI Ecommerce Tools Editorial Team. Our mission is to help businesses, marketers, ecommerce brands, agencies, and content creators choose the best AI software through practical testing, unbiased comparisons, and regularly updated educational resources.
We evaluate AI tools based on usability, features, pricing, integrations, performance, and real-world marketing value. Our content is updated frequently to reflect new product releases, feature enhancements, pricing changes, and emerging industry trends.
Editorial Standards
Independent and research-driven reviews
Practical recommendations based on real use cases
Regular content updates
Focus on SEO, AEO, GEO, and E-E-A-T best practices.
Commitment to accuracy, transparency, and user value
Editorial Note: This article was last reviewed in August 2026. We recommend revisiting this guide periodically, as AI marketing tools and features evolve rapidly.
Disclaimer
This content is provided for educational and informational purposes only. While we strive to keep all information accurate and up to date, AI software features, pricing, integrations, and availability may change over time. Always verify the latest information on the official website before making purchasing or business decisions.
How We Evaluate AI Tools
Every AI tool featured on AI Ecommerce Tools is evaluated using a consistent editorial methodology. We assess products based on:
Features & capabilities
Ease of use
Pricing & overall value
Integrations
Customer support
Security & privacy
Real-world business use cases
Performance and reliability
Our goal is to provide objective, research-based recommendations rather than promotional rankings.
Content Update Policy
We review this guide regularly to ensure accuracy. Whenever major AI platforms release new features, pricing updates, or significant improvements, this article is revised accordingly to keep readers informed with the latest information.
Share This Guide
If this guide was helpful, please share it with your colleagues, marketing team, or other business owners. Sharing reliable AI resources helps everyone make smarter choices about using artificial intelligence.
Thank you for reading!
We hope this guide helps you choose the best AI marketing tools for your business with confidence. As AI keeps changing, we’ll work to keep this resource accurate, practical, and current so you can make smart marketing decisions.
AI Analytics and CRO Tools in 2026: A Comprehensive Guide to Conversion Growth
Artificial intelligence has made website analytics quicker, easier to use, and more proactive. Marketers no longer need to sift through endless reports or watch hours of session recordings. Now, machine learning can spot unusual behavior, summarize customer journeys, find valuable segments, and suggest ways to improve results AI Analytics and CRO tools. Still, an AI recommendation does not guarantee a good business decision. Analytics can show patterns, but user research adds context. Controlled experiments are needed to see if a suggested change really makes things better. This guide shows how to bring these elements together into a practical system for improving conversions.
Quick Answer: AI analytics tools use machine learning to identify patterns, predict outcomes, summarize behavior, and surface unusual changes in website or product data. AI Analytics and CRO tools help businesses investigate conversion barriers, create alternative experiences, run controlled experiments, and measure whether those changes improve meaningful outcomes such as purchases, leads, or subscriptions.
AI Analytics and CRO tools are the use of machine learning, predictive modeling, natural language analysis, and automated pattern detection to understand digital behavior.
Conversion rate optimization, or CRO, is the systematic process of improving the percentage of qualified visitors who complete a desired action.
That action might include:
Purchasing a product
Requesting a quote
Booking a consultation
Creating an account
Starting a free trial
Subscribing to a newsletter
Completing an onboarding step
AI Analytics vs. Traditional Analytics
Traditional analytics usually requires the user to decide what report to open, which segment to examine, and what pattern to investigate.
AI-assisted analytics can help by:
Detecting unexpected increases or decreases Summarizing complex reports Predicting purchase or churn probability Grouping similar customer behaviors Identifying likely conversion barriers Suggesting questions or test ideas Allowing users to query data in natural language
Google Analytics, for example, uses machine learning to generate predictive metrics such as purchase probability, churn probability, and predicted revenue when a property meets the applicable data requirements. (Google Help)
AI Analytics and CRO tools Solve Different Problems
Discipline
Primary Question
Typical Output
Web analytics
What happened?
Traffic, events, revenue and funnel reports
Behavioral analytics
How did visitors interact?
Heatmaps, recordings and journey patterns
Customer research
Why did it happen?
Survey responses, interviews and objections
Predictive analytics
What may happen next?
Propensity scores, forecasts and risk alerts
Experimentation
Did the proposed change work?
Measured uplift, loss or inconclusive result
Personalization
Which experience fits this visitor?
Segment-specific content or offers
A strong optimization program uses all six layers rather than relying on one dashboard.
How AI Is Changing AI Analytics and CRO tools
Quick Answer: In 2026, AI is reducing the time required to move from raw behavioral data to a testable hypothesis. Modern platforms can summarize sessions, detect anomalies, answer natural-language questions, predict outcomes, and generate experiment ideas. Human judgment is still required to validate context, business relevance, data quality, and statistical evidence.
Faster Insight Discovery
A marketer may have thousands of customer journeys, event combinations, and session recordings to examine. AI Analytics and CRO tools can reduce this workload by grouping related behavior and summarizing recurring patterns. Microsoft Clarity, for example, offers AI-assisted session insights, while its grouped insights capability can summarize multiple recordings filtered by attributes such as device, events, campaign, or visited page. (Microsoft Learn)
This does not mean the AI has established the cause of a conversion problem. It means the system has helped identify where a human should investigate.
Natural-Language Data Exploration
Instead of building every report manually, teams can increasingly ask questions such as:
Which acquisition channel produced the most repeat purchasers?
Where do mobile visitors leave the checkout?
Which product features correlate with higher retention?
Did the new pricing page change demo requests?
What behavior is common among high-value customers?
Natural-language interfaces make analytics more accessible, but the quality of the answer still depends on accurate event tracking, naming conventions, attribution logic, and data governance.
Predictive Segmentation
Predictive systems can identify visitors who are more likely to purchase, churn, upgrade, or return.
These predictions may support:
Retargeting audiences
Email prioritization
Personalized product recommendations
Customer-success interventions
Promotional suppression
High-intent audience analysis
A predictive score should be treated as a probability, not a guarantee.
Automated Hypothesis Generation
AI can transform observations into structured test ideas. For example:
Observation: Mobile visitors frequently return to the shipping-information section. Possible AI-generated hypothesis: Visitors may not understand delivery costs or arrival dates before checkout. Potential test: Display estimated delivery dates and shipping thresholds directly on product pages. Primary metric: Product-to-checkout rate. Guardrail metric: Refund or cancellation rate.
The system accelerates ideation, but the optimization team must decide whether the hypothesis is logical, technically feasible, ethical, and valuable enough to test.
Essential AI Analytics and CRO Tools Capabilities
Quick Answer: The best platform is not always the one with the most AI features. Pick tools that offer reliable data, useful segmentation, clear behavioral context, good experiment tracking, helpful integrations, strong privacy controls, and transparent results. AI should help you analyze faster, but not hide how it reached its conclusions or push changes that have not been checked.
Core Capability Checklist
Capability
What It Should Help You Do
Warning Sign
Event analytics
Measure important customer actions
Tracking only pageviews
Funnel analysis
Locate major journey drop-offs
Inconsistent funnel definitions
Segmentation
Compare meaningful audience groups
Too many unused segments
Heatmaps
See aggregate clicks and scrolling
Treating visual activity as intent
Session replay
Investigate individual experiences
Recording sensitive information
Surveys and feedback
Understand motivations and objections
Asking biased questions
Anomaly detection
Find unusual changes quickly
Alerting without business context
Predictive analysis
Estimate future behavior
Presenting probability as certainty
A/B testing
Measure causal impact
Stopping tests when results look positive
Personalization
Tailor experiences by segment
Creating experiences without validation
AI summaries
Reduce manual review time
Summaries without links to evidence
Integrations
Connect marketing, product and revenue data
Isolated dashboards
Governance
Maintain consistent definitions and access
Uncontrolled event creation
Transparent AI Outputs
A useful AI-generated insight should show:
The observation: What pattern was detected?
The segment: Which visitors were affected?
The timeframe: When did the behavior occur?
The evidence: Which sessions, events, or reports support it?
The confidence: How strong or consistent is the pattern?
The next action: What should a person investigate or test?
Avoid tools that make strong recommendations but do not show the evidence behind them. Privacy and Data Controls
Privacy and Data Controls
Your platform should support appropriate controls for:
Personally identifiable information
Form-field masking
Consent management
Data retention
User access
Data deletion
Geographic storage requirements
Internal governance
Always set up analytics and replay tools to follow the law, your company’s policies, and the latest instructions from the platform.
Best AI Analytics and CRO Tools by Use Case
Quick Answer: There is no single best platform for every organization. Google Analytics and Mixpanel emphasize event and journey analysis. Clarity and Hotjar provide behavioral context. VWO and Optimizely support structured experimentation and personalization. The right choice depends on your traffic, technical resources, decision needs, existing data stack, and experimentation maturity.
Tool Comparison
Tool
Best For
Notable Capabilities
Considerations
Google Analytics 4
Website and ecommerce measurement
Event-based analytics, funnels, audiences and eligible predictive metrics (Google Help)
Requires disciplined configuration and event governance
Microsoft Clarity
Accessible behavioral analysis
Heatmaps, session recordings and AI-assisted insights; Microsoft presents Clarity as free with no traffic limit (Microsoft Learn)
Best used with a quantitative analytics platform
Hotjar
UX research and visitor feedback
Heatmaps, session replay, funnels, surveys and feedback tools (Hotjar)
Sampling, limits and available features depend on the current plan
Mixpanel
Product and journey analytics
Event analysis, flows, funnels, experimentation-related workflows and AI-assisted exploration (Mixpanel)
Requires a carefully designed tracking plan
VWO
Connected CRO and experimentation
Behavioral insights, testing, personalization, feature experimentation and AI-assisted hypothesis development (VWO)
May be more platform than a small site initially needs
Optimizely
Enterprise experimentation
Web and feature experimentation, feature flags, personalization and controlled rollouts (Optimizely)
Implementation usually requires technical and operational maturity
Features, limits, integrations, and prices may change over time. Check the vendor’s latest plan before you decide to buy.
Best Starter
For a new content site, lead-generation business, or small ecommerce store:
Google Analytics 4 for event and acquisition measurement
Microsoft Clarity for heatmaps and session investigation
A simple survey or customer-feedback tool
A spreadsheet or project board for hypothesis tracking
This setup is sufficient to begin identifying and prioritizing conversion problems without purchasing a full experimentation suite.
Best Growth-Stage Stack
For a growing ecommerce or software business:
GA4 or Mixpanel for quantitative analysis
Clarity or Hotjar for behavioral evidence
VWO or another testing platform for experiments
CRM and revenue-data integration
A centralized testing and learning repository
Best Enterprise Stack
An enterprise may require:
A customer data platform or data warehouse
Product and web analytics
Server-side experimentation
Feature-flag management
Personalization
Consent and identity controls
Automated data-quality monitoring
A formal experimentation governance process
The goal for an enterprise is not to gather as many tools as possible. Instead, focus on building a reliable decision-making system that works across teams.
How to Choose the Right Tool Stack
Quick Answer: Start with the business decisions you need to make, not a list of fashionable features. Evaluate whether each platform can collect trustworthy data, answer your priority questions, integrate with existing systems, support your experiment type, protect customer information, and produce insights your team can realistically act on.
Start With Decision Requirements
Before comparing vendors, document five to ten recurring decisions, such as:
Which landing page deserves optimization first?
Why are mobile users abandoning checkout?
Which acquisition channels generate profitable customers?
Which product features improve retention?
Does a redesigned form increase qualified leads?
Which visitor segments respond to a specific offer?
A platform is useful if it helps you answer these questions clearly and quickly.
Use a Weighted Evaluation Scorecard
Score each tool from 1 to 5, multiply the score by the assigned weight, and compare the totals.
Evaluation Area
Suggested Weight
Data accuracy and flexibility
20%
Experimentation capability
20%
Behavioral insight
15%
Integrations and data portability
15%
Privacy and governance
10%
AI transparency and usefulness
10%
Ease of implementation
5%
Total cost of ownership
5%
Adjust the weights according to your organization.
A content publisher may assign more weight to usability and attribution. A software company may prioritize product events and feature experimentation. An enterprise may give governance and integration significantly more weight.
Run a Real-World Proof of Concept
Do not evaluate a tool only through a sales demonstration.
Give each shortlisted platform the same assignment:
Identify a real funnel problem.
Segment affected users.
Provide supporting evidence.
Create a testable hypothesis.
Estimate the implementation effort.
Explain how success would be measured.
The best tool is the one that helps your team make solid decisions, not just the one with the most features listed.
Pro Tip: Measure time to evidence, not simply time to dashboard. A fast report has little value when the team still cannot decide what to do.
How to Implement an AI Analytics and CRO tools Process
Quick Answer: A reliable CRO process begins with a business outcome, validates tracking, establishes a baseline, combines quantitative and qualitative evidence, prioritizes one hypothesis, runs an appropriately designed experiment, and records the result. AI can accelerate each step, but it should not replace data validation, customer context, or controlled measurement.
Step 1: Define the Business Outcome
Avoid beginning with “increase engagement.” Use a measurable result such as:
Increase completed purchases
Increase qualified demo requests
Reduce checkout errors
Increase trial-to-paid conversion
Improve repeat purchase rate
Reduce subscription cancellations
Separate the final business outcome from supporting behaviors.
For example:
Metric Type
Ecommerce Example
North-star outcome
Profit per eligible visitor
Primary conversion
Completed purchase
Supporting metric
Checkout-start rate
Diagnostic metric
Payment error rate
Guardrail metric
Refund rate
Step 2: Build a Tracking Plan
Your tracking plan should document:
Field
Example
Event name
begin_checkout
Trigger
Visitor opens the first checkout step
Required properties
Cart value, currency, device and product count
User scope
Anonymous or authenticated user
Business owner
Ecommerce manager
Technical owner
Analytics engineer
Validation method
Debug test and completed test order
Use consistent event names and definitions. Multiple teams should not use different terms for the same action.
Step 3: Validate the Data
Before trusting an AI-generated insight, confirm that:
Events fire at the correct moment
Important events are not duplicated
Revenue values use the right currency
Internal traffic is handled consistently
Test transactions are identifiable
Campaign parameters are preserved
Cross-domain journeys work correctly
Consent choices are respected
Bot activity is considered
Mobile and desktop behavior are both represented
If your data is poor, adding AI leads to faster bad advice.
Step 4: Establish a Baseline
Document the current performance before making any changes.
Include:
Date range
Audience definition
Traffic sources
Device mix
Conversion rate
Average order value
Revenue per visitor
Error rate
Refund or cancellation rate
Significant promotions or operational changes
Step 5: Use the Evidence Triangle
A conversion problem should ideally be supported by three evidence types.
Quantitative Evidence
What is happening?
Example: Mobile checkout completion is lower than desktop completion.
Behavioral Evidence
How is the problem occurring?
Example: Recordings show repeated taps on a non-clickable delivery-information element.
Voice-of-Customer Evidence
Why might it be occurring?
Example: Survey responses show uncertainty about delivery dates.
When all three point toward the same problem, the hypothesis becomes more credible.
Step 6: Write a Testable Hypothesis
Use this structure:
Because we observed [evidence], we believe [change] for [audience] will improve [primary metric]. We will monitor [guardrail metrics] to ensure the change does not create a harmful side effect.
Example:
Because mobile visitors repeatedly search for delivery information before leaving the cart, we believe displaying an estimated delivery date beside the checkout button will increase mobile checkout completion. We will monitor refunds, cancellations, and customer-support contacts.
Step 7: Prioritize the Hypothesis
A simple prioritization model can evaluate:
Impact: How valuable could the result be?
Evidence: How strongly is the problem supported?
Reach: How many qualified visitors are affected?
Effort: How much design and development work is required?
Risk: Could the change harm revenue, trust, accessibility, or operations?
The score does not make the decision for you. Instead, it helps your team see and discuss the assumptions behind your choices.
Step 8: Test, Learn, and Document
Every experiment record should include:
Hypothesis
Supporting evidence
Target audience
Variations
Primary metric
Guardrail metrics
Planned duration or stopping rule
Technical quality assurance
Result
Decision
Follow-up insight
An inconclusive test is still useful when it eliminates a weak assumption or improves the next hypothesis.
AI Analytics and CRO Tools Conversion Metrics
Quick Answer: Track metrics that connect user behavior to business value. Use one clearly defined primary outcome, a small group of diagnostic indicators, and guardrail metrics that detect harmful side effects. Avoid celebrating clicks or engagement when those behaviors do not improve revenue, qualified leads, retention, profitability, or customer success.
Essential CRO Metrics
Metric
Formula
What It Reveals
Conversion rate
Conversions ÷ eligible visitors × 100
Percentage completing the target action
Revenue per visitor
Revenue ÷ eligible visitors
Traffic value independent of conversion rate alone
Average order value
Revenue ÷ orders
Average purchase size
Add-to-cart rate
Add-to-cart users ÷ product viewers × 100
Product-page effectiveness
Cart-to-checkout rate
Checkout starters ÷ cart users × 100
Cart-page effectiveness
Checkout completion
Purchasers ÷ checkout starters × 100
Checkout friction
Lead qualification rate
Qualified leads ÷ total leads × 100
Lead quality
Trial activation rate
Activated users ÷ trial users × 100
Initial product value
Retention rate
Returning active users ÷ cohort size × 100
Continued customer value
Relative uplift
(Variant rate − control rate) ÷ control rate × 100
Relative experiment change
Choose the Correct Denominator
A site-wide conversion rate can be misleading.
For example, a product-page test should usually be evaluated among users who were eligible to see that product-page experience—not every visitor to the website.
Define:
Who qualified for the experiment
Whether measurement is user-based or session-based
How repeat visits are handled
How cross-device behavior is treated
Which traffic should be excluded
Use Guardrail Metrics
A variation may increase purchases while causing another problem.
Useful guardrails include:
Refund rate
Cancellation rate
Customer-support contact rate
Page-load performance
JavaScript error rate
Product return rate
Gross margin
Subscription churn
Accessibility issues
Do not pick a winner by looking only at the main metric. Always check the full picture.
AI Analytics and CRO tools for Ecommerce
Quick Answer: Ecommerce optimization should connect the entire journey—from product discovery and product evaluation to cart, checkout, delivery, and repeat purchase. AI can identify high-friction segments and recurring behavior, while CRO methods determine whether proposed improvements increase profitable orders without increasing refunds, cancellations, support demand, or customer dissatisfaction.
Baymard’s ecommerce research places the average cart-abandonment rate at approximately 70%, illustrating how much commercial intent can be lost before purchase completion. (Baymard Institute)
That number does not mean every abandoned cart represents a recoverable sale. Some visitors are comparing prices, saving products, or browsing without immediate purchase intent. The CRO objective is to identify avoidable friction among qualified shoppers.
Ecommerce Optimization Map
Journey Stage
Useful Signals
Potential CRO Action
Primary Metric
Landing page
Message mismatch, quick exits
Align content with campaign intent
Qualified product views
Category page
Filter use, zero-result searches
Improve filtering and sorting
Product discovery rate
Product page
Image interaction, review usage
Clarify value, sizing and delivery
Add-to-cart rate
Cart
Coupon hunting, shipping uncertainty
Show cost and delivery information
Checkout-start rate
Checkout
Form errors, repeated backtracking
Simplify fields and clarify errors
Checkout completion
Post-purchase
Support requests, cancellations
Improve confirmation and tracking
Cancellation rate
Retention
Reorder timing, category affinity
Personalize reminders and discovery
Repeat purchase rate
Product-Page Analysis
Use AI Analytics and CRO tools to compare:
Mobile and desktop visitors
New and returning customers
Paid and organic traffic
High- and low-priced products
In-stock and low-stock products
Products with and without reviews
Visitors who used search
Visitors who viewed delivery information
Behavioral evidence may reveal:
Important details appearing too far down the page
Images that visitors expect to enlarge
Confusing size or variation selectors
Weak visibility of return information
Accidental taps
Repeated interaction with unavailable options
Poor mobile placement of the add-to-cart button
Checkout Analysis
Break checkout into distinct stages:
Cart review
Account or guest selection
Shipping information
Delivery method
Payment
Order review
Confirmation
Looking at just one overall abandonment rate will not tell you which part of the process needs work.
The AI Confidence Ladder
Use this five-level framework before acting on an automated recommendation:
Level
Evidence
Recommended Action
1
AI-generated suggestion only
Investigate
2
Suggestion plus quantitative pattern
Review segments
3
Quantitative and behavioral evidence
Develop a hypothesis
4
Evidence plus customer feedback
Prioritize a test
5
Controlled experiment confirms impact
Implement and monitor
This helps teams avoid mistaking a good-sounding AI explanation for real proof of cause and effect.
A Human-AI CRO Operating Model
Quick Answer: The strongest operating model gives AI responsibility for pattern discovery, summarization, classification, and first-draft hypotheses. Humans remain responsible for strategy, customer context, ethics, prioritization, creative judgment, and quality assurance. Controlled experiments or carefully designed before-and-after evaluations remain responsible for determining whether a change produced the intended result.
What AI Should Do
AI is well suited to:
Summarizing large sets of feedback
Grouping similar session behaviors
Detecting unusual metric movements
Drafting test hypotheses
Suggesting audience segments
Converting findings into structured reports
Identifying repeated objections
Generating alternative copy concepts
Highlighting possible data-quality issues
What Humans Should Do
Human specialists should:
Select meaningful business outcomes
Determine whether the data is trustworthy
Understand operational constraints
Recognize customer sensitivities
Reject misleading correlations
Protect user privacy
Prioritize opportunities
Design credible experiments
Evaluate brand and accessibility implications
Approve implementation decisions
What Experiments Should Decide
Experiments should answer questions such as:
Did the variation increase the primary outcome?
Was the result consistent across important segments?
Did it create a negative guardrail effect?
Is the effect commercially meaningful?
Can the result be replicated?
Should the change be implemented, revised, or rejected?
Expert Quote Placeholder: “[Insert a quote from a CRO specialist explaining why AI-generated hypotheses must be validated with customer evidence and controlled measurement.]”
Measure Decision Latency
A useful operational metric is decision latency:
The time between detecting a meaningful problem and reaching an evidence-based decision about it.
AI may reduce analysis time, but decision latency remains high when:
Tracking cannot be trusted
No one owns the metric
Development queues are unclear
Tests require excessive approval
Findings are spread across multiple tools
Previous experiment results cannot be found
Optimizing the operating process may produce more value than purchasing another platform.
Common Mistakes to Avoid
Quick Answer: Common failures include collecting data without a decision plan, trusting AI summaries without reviewing the evidence, testing low-impact cosmetic changes, using inconsistent metrics, stopping experiments prematurely, ignoring mobile segments, and optimizing conversion rate at the expense of profitability or retention. Successful CRO requires disciplined measurement, prioritization, documentation, and organizational follow-through.
Mistake
Why It Fails
Better Approach
Installing too many tools
Creates duplicated data and conflicting reports
Assign each tool a defined purpose
Tracking everything
Produces noise and governance problems
Track decisions and meaningful behaviors
Accepting AI explanations as facts
Pattern recognition does not prove causation
Review evidence and test the hypothesis
Watching random recordings
Encourages anecdotal conclusions
Segment recordings around a defined problem
Testing button colors without evidence
Usually targets a weak opportunity
Begin with customer friction or value clarity
Using only conversion rate
Can hide changes in order value or quality
Include revenue and guardrail metrics
Ignoring sample composition
Changes in traffic can distort performance
Compare equivalent audiences
Running many overlapping tests
Makes effects difficult to attribute
Coordinate experiments and exposure
Ending tests when results look favorable
Increases decision risk
Define rules before launch
Failing to document losses
Causes teams to repeat failed ideas
Maintain a searchable learning repository
Personalizing too early
Scales an unvalidated assumption
Validate the base experience first
Optimizing only for acquisition
Misses retention and customer value
Measure the full customer lifecycle
Avoid Optimization Debt
Optimization debt occurs when a company runs many tests but fails to maintain the following:
Accurate documentation
Reusable components
Consistent metrics
Permanent implementation quality
Post-launch monitoring
A record of customer insights
The team appears busy, but its ability to learn becomes weaker over time.
30-Day AI Analytics and CRO Tools Action Plan
Quick Answer: In your first 30 days, focus on getting your measurements right, picking one key customer journey, and finding one optimization backed by evidence. Do not try to automate everything at once. Set up reliable tracking, analyze funnel steps, gather behavioral and customer feedback, choose a main hypothesis, and get ready to run a well-measured experiment.
Week 1: Measurement Foundation
Select one primary conversion journey.
Define the primary business outcome.
Audit existing analytics events.
Confirm revenue and conversion values.
Remove duplicate or unclear events.
Document the event taxonomy.
Verify mobile and desktop tracking.
Establish baseline metrics.
Deliverable: Approved measurement plan and baseline report.
Week 2: Friction Discovery
Build the journey funnel.
Segment by device and traffic source.
Identify the largest meaningful drop-off.
Review relevant heatmaps.
Watch a focused sample of sessions.
Collect survey or support-ticket evidence.
Use AI to group recurring observations.
Deliverable: Evidence summary containing three to five prioritized problems.
Week 3: Hypothesis Development
Convert observations into structured hypotheses.
Estimate reach and potential impact.
Assess implementation effort and risk.
Choose one primary hypothesis.
Define the primary and guardrail metrics.
Design the control and variation.
Complete technical and analytics quality assurance.
Deliverable: Experiment brief ready for launch.
Week 4: Launch and Governance
Launch the test or controlled change.
Monitor technical integrity.
Avoid making decisions from early fluctuations.
Document external factors such as campaigns or outages.
Create a central learning repository.
Schedule the result review.
Add follow-up opportunities to the roadmap.
Deliverable: Active experiment and repeatable CRO workflow.
Frequently Asked Questions
Quick Answer: Businesses commonly want to know which AI analytics platform is best, whether AI can automatically increase conversions, how much traffic testing requires, and whether free tools are sufficient. The correct answer usually depends on the organization’s measurement quality, traffic volume, business model, technical resources, and ability to act on evidence.
What Is the Best AI Analytics Tool?
Quick Answer: The best platform depends on your use case. Google Analytics is useful for broad website and acquisition measurement, while Mixpanel emphasizes event-based product journeys. Clarity and Hotjar provide behavioral context. Evaluate tools using your own tracking requirements, integrations, privacy needs, team skills, and recurring business decisions.
What Is the Best CRO Tool for Ecommerce?
Quick Answer: Ecommerce businesses usually need a combination rather than one tool. Use quantitative analytics to locate funnel losses, behavioral analytics to investigate friction, customer feedback to understand objections, and an experimentation platform to validate proposed improvements. The most appropriate vendor depends on traffic, platform compatibility, testing complexity, budget, and internal expertise.
Can AI Automatically Improve a Website’s Conversion Rate?
Quick Answer: AI can detect patterns, summarize behavior, generate ideas, and automate some personalization, but it cannot guarantee higher conversions. Recommendations may be based on incomplete data or misleading correlations. Important changes should be reviewed by a person and validated through controlled experiments or another credible measurement design before full implementation.
Is Google Analytics a CRO tool?
Quick Answer: Google Analytics is primarily a measurement and analysis platform rather than a complete CRO system. It can reveal traffic performance, events, funnels, audiences, and conversion patterns, but teams usually combine it with behavioral research, customer feedback, and experimentation tools to understand friction and verify whether proposed changes improve results.
What Is the Difference Between Web Analytics and CRO?
Quick Answer: Web analytics measures what visitors do, including where they arrive, which events they complete, and where they leave. CRO uses that data alongside behavioral research, customer feedback, and experiments to improve a specific business outcome. Analytics produces evidence; CRO turns evidence into prioritized changes and validated learning.
Do Small Websites Need A/B Testing?
Quick Answer: Small websites need optimization, but they may not always have enough eligible traffic for frequent conventional A/B tests. They can still improve through analytics audits, usability testing, surveys, customer interviews, message testing, and carefully monitored changes. The measurement method should match the traffic volume, risk, and expected effect size.
How Much Traffic Is Needed for a CRO Test?
Quick Answer: There is no universal traffic requirement. The required sample depends on the baseline conversion rate, minimum effect worth detecting, statistical approach, number of variations, traffic allocation, and acceptable uncertainty. Calculate requirements before launch and avoid choosing a sample size simply because another website used the same number.
Are AI-Generated CRO Recommendations Reliable?
Quick Answer: AI recommendations are useful starting points, not final proof. Reliability depends on tracking accuracy, data volume, segment relevance, model design, and the evidence shown with the recommendation. Review the underlying sessions, events, feedback, and business context. Use experimentation to determine whether the suggested change causes a meaningful improvement.
Which Metrics Matter Most for Ecommerce CRO?
Quick Answer: Important ecommerce metrics include revenue per eligible visitor, purchase conversion rate, add-to-cart rate, checkout-start rate, checkout completion, average order value, gross margin, refund rate, cancellation rate, and repeat purchase rate. Select one primary outcome and use supporting and guardrail metrics to explain both benefits and possible harm.
Can I Start With Free Analytics and CRO Tools?
Quick Answer: Yes. A small business can begin with a basic analytics platform, Microsoft Clarity, customer surveys, and a documented optimization process. Paid tools become more valuable when the business needs advanced experimentation, deeper segmentation, more integrations, longer retention, collaboration workflows, stronger governance, or support for higher traffic and organizational complexity.
How Often Should a Business Review CRO Data?
Quick Answer: Technical alerts and serious conversion changes may require daily monitoring, while strategic funnel and experiment reviews are often more useful weekly or biweekly. Broader roadmap and customer-journey reviews can be conducted monthly or quarterly. Choose a schedule that enables action without encouraging teams to react to ordinary short-term variation.
Will AI Replace CRO Specialists?
Quick Answer: AI is more likely to change CRO work than eliminate it. It can accelerate analysis, summarization, segmentation, and idea generation. Specialists are still needed to choose meaningful problems, evaluate evidence, understand customer context, design valid experiments, manage risk, interpret results, and translate findings into commercially and ethically sound decisions.
Final Verdict
Quick Answer: AI analytics and CRO tools work best when they come together as one evidence system. Use analytics to find problems, behavioral research to understand what is happening, customer feedback to learn why, and experiments to test solutions. Let AI speed up discovery, but keep people in charge of judgment, oversight, and final choices.
The most effective conversion stack is not the one with the greatest number of dashboards or automated recommendations. It is the one that repeatedly helps your team answer four questions:
Where is meaningful performance being lost?
What evidence explains the problem?
Which proposed solution deserves testing?
Did the change create a valuable and sustainable outcome?
Begin with a reliable measurement and one important customer journey. Add behavioral evidence. Listen to customers. Prioritize a testable hypothesis. Measure the result with a primary metric and appropriate guardrails.
In 2026, AI can make this process much faster. But the real advantage comes from using that speed to make careful, customer-focused decisions.
About the Author
AI Ecommerce Tools Editorial Team
This guide was researched, reviewed, and maintained by the AI Ecommerce Tools Editorial Team. Our mission is to help businesses, marketers, ecommerce brands, agencies, and content creators choose the best AI software through practical testing, unbiased comparisons, and regularly updated educational resources.
We evaluate AI tools based on usability, features, pricing, integrations, performance, and real-world marketing value. Our content is updated frequently to reflect new product releases, feature enhancements, pricing changes, and emerging industry trends.
Editorial Standards
Independent and research-driven reviews
Practical recommendations based on real use cases
Regular content updates
Focus on SEO, AEO, GEO, and E-E-A-T best practices.
Commitment to accuracy, transparency, and user value
Editorial Note: This article was last reviewed in August 2026. We recommend revisiting this guide periodically, as AI marketing tools and features evolve rapidly.
Disclaimer
This content is provided for educational and informational purposes only. While we strive to keep all information accurate and up to date, AI software features, pricing, integrations, and availability may change over time. Always verify the latest information on the official website before making purchasing or business decisions.
How We Evaluate AI Tools
Every AI tool featured on AI Ecommerce Tools is evaluated using a consistent editorial methodology. We assess products based on:
Features & capabilities
Ease of use
Pricing & overall value
Integrations
Customer support
Security & privacy
Real-world business use cases
Performance and reliability
Our goal is to provide objective, research-based recommendations rather than promotional rankings.
Content Update Policy
We review this guide regularly to ensure accuracy. Whenever major AI platforms release new features, pricing updates, or significant improvements, this article is revised accordingly to keep readers informed with the latest information.
Share This Guide
If this guide was helpful, please share it with your colleagues, marketing team, or other business owners. Sharing reliable AI resources helps everyone make smarter choices about using artificial intelligence.
Thank you for reading!
We hope this guide helps you choose the best AI marketing tools for your business with confidence. As AI keeps changing, we’ll work to keep this resource accurate, practical, and current so you can make smart marketing decisions.